Monitoring an ASP.NET api with OpenTelemetry and SigNoz
Posted 2023-04-07 12:00:00 by sanyi ‐ 6 min read
This is a short introduction to OpenTelemetry and SigNoz using C#. I built a simple REST API with ASP.NET 7, added OpenTelemetry instrumentation to it and forwarded the data to SigNoz.
What is OpenTelemetry? According to their site opentelemetry.io:
"OpenTelemetry is a collection of tools, APIs, and SDKs. Use it to instrument, generate, collect, and export telemetry data (metrics, logs, and traces) to help you analyze your software’s performance and behavior."
A simple use case: you have a webservice in production and it uses multiple data sources: SQL servers, REST APIs, etc. Consumers start to complain that the service is slow, but you cannot identify the source of the problem easily. Maybe one of the backend SQL servers or REST APIs is slow or your own code. With OpenTelemetry you can instrument your code to measure not just the duration of each API call but different slices of it: the duration of the required SQL queries, backend REST API calls.
OpenTelemetry shows its real strength when your service is not a single webservice but a complicated mesh of microservices. With the help of OpenTelemetry and distributed tracing you can identify the root causes of slowdowns in that scenario too.
I used Ubuntu Linux for this test, so if you use Windows you will have to use a WSL2 environment to follow these steps.
I started with a very simple ASP.NET Core 7 web application:
dotnet new web -o DotnetWebApiTelemetry
Added a new file to the project named Data.cs:
public class Hello
{
    public string Message { get; set; } = "";

    public Hello(string message)
    {
        Message = message;
    }
}
This class will be our API response.
Edited Program.cs to add our hello endpoint:
var builder = WebApplication.CreateBuilder(args);

var app = builder.Build();

app.MapGet("/", () => "Hello World!");

app.MapGet("/hello", () => new Hello("Hello World!") );

app.Run();
Let's build and start the application:
$ dotnet run
Building...
info: Microsoft.Hosting.Lifetime[14]
      Now listening on: http://localhost:5263
info: Microsoft.Hosting.Lifetime[0]
      Application started. Press Ctrl+C to shut down.
info: Microsoft.Hosting.Lifetime[0]
      Hosting environment: Development
info: Microsoft.Hosting.Lifetime[0]
      Content root path: /home/sapati/Desktop/Code/DotnetWebApiTelemetry
It says it's listening on http://localhost:5263 so open it in your browser.
It should say Hello World!
Now test our hello API endpoint:
$ curl -v http://localhost:5263/hello

*   Trying 127.0.0.1:5263...
* Connected to localhost (127.0.0.1) port 5263 (#0)
> GET /hello HTTP/1.1
> Host: localhost:5263
> User-Agent: curl/7.81.0
> Accept: */*
>
* Mark bundle as not supporting multiuse
< HTTP/1.1 200 OK
< Content-Type: application/json; charset=utf-8
< Date: Fri, 07 Apr 2023 08:00:23 GMT
< Server: Kestrel
< Transfer-Encoding: chunked
<
* Connection #0 to host localhost left intact

{"message":"Sleeped for 201"}
Let's add OpenTelemetry to our application. First install the dependencies:
dotnet add package OpenTelemetry.Exporter.Console
dotnet add package OpenTelemetry.Extensions.Hosting
dotnet add package OpenTelemetry.Instrumentation.AspNetCore --prerelease
Next extend our Program.cs to add the OpenTelemetry setup:
using System.Diagnostics;
using OpenTelemetry.Metrics;
using OpenTelemetry.Resources;
using OpenTelemetry.Trace;

var builder = WebApplication.CreateBuilder(args);

builder.Services.AddOpenTelemetry()
    .WithTracing(tracerProviderBuilder =>
        tracerProviderBuilder
            .AddSource(DiagnosticsConfig.ActivitySource.Name)
            .ConfigureResource(resource => resource
                .AddService(DiagnosticsConfig.ServiceName))
            .AddAspNetCoreInstrumentation()
            .AddConsoleExporter())
    .WithMetrics(metricsProviderBuilder =>
        metricsProviderBuilder
            .ConfigureResource(resource => resource
                .AddService(DiagnosticsConfig.ServiceName))
            .AddAspNetCoreInstrumentation()
            .AddConsoleExporter());

public static class DiagnosticsConfig
{
    public const string ServiceName = "HelloService";
    public static ActivitySource ActivitySource = new ActivitySource(ServiceName);
}
This setup uses ConsoleExporter so it simply dumps the tracing info to the standard output.
Let's build and run again our application. When you call the endpoint with curl, you should see the tracing output showing up in the console of the application.
To process the tracing data generated by OpenTelemetry we need to use a collector application. There are multiple open-source options such as Jaeger and Zipkin and SigNoz. I used SigNoz for these tests.
The test setup is quite simple. Clone the SigNoz repository:
git clone -b main https://github.com/SigNoz/signoz.git && cd signoz/deploy/
and run the install.sh in the signoz/deploy directory:
./install.sh
The script will setup a test environment using docker-compose, it takes a few minutes to create all the containers and initialize the database.
When the setup completes, open the administration console and create the default
admin user at http://localhost:3301/.
After login you will see the traces of the SigNoz application itself.
Now let's change the configuration of our .NET application to use SigNoz.
SigNoz listens for telemetry data using the OTLP protocol on port 4317.
This is the default configuration for OpenTelemetry, so we only have
to change from ConsoleExporter to OtlpExporter:
builder.Services.AddOpenTelemetry()
    .WithTracing(tracerProviderBuilder =>
        tracerProviderBuilder
            .AddSource(DiagnosticsConfig.ActivitySource.Name)
            .ConfigureResource(resource => resource
                .AddService(DiagnosticsConfig.ServiceName))
            .AddAspNetCoreInstrumentation()
            .AddOtlpExporter())
    .WithMetrics(metricsProviderBuilder =>
        metricsProviderBuilder
            .ConfigureResource(resource => resource
                .AddService(DiagnosticsConfig.ServiceName))
            .AddAspNetCoreInstrumentation()
            .AddOtlpExporter());
Build and run our application again. To see something usable in SigNoz it's not enough to call our endpoint a single time with curl, we have to put real load on the application. I used the apache benchmark tool (ab) to do this:
ab -n 1000000 -c 10 http://localhost:5263/hello
You can stop the tool at any time with Ctrl+C
After running it for a few minutes you will start to see HelloService data in SigNoz.
Now this is nice, but our application is too fast to see anything useful in SigNoz. Let's add a little jitter to it: wait for a few hundred millisecs before returning the response. This simulates a slow backend API or SQL call.
Create a new file, named Service.cs:
public class Service
{
    private static Random _rand = new Random();

    async public static Task<Hello> run()
    {
        var sleepTime = _rand.Next(100, 300);

        await Task.Delay(sleepTime);

        return new Hello($"Sleeped for {sleepTime}");
    }
}
It will sleep for somewhere between 100 and 300 millisecs.
Now change our handler mapping in Program.cs:
app.MapGet("/hello", async () => await Service.run());
build and run our application again, finally start ab as the load simulator:
ab -n 1000000 -c 10 http://localhost:5263/hello
Now SigNoz starts to show some meaningful data: the response time varies between a 100 and 300 millisecs, averaging nicely at 200ms. There may even be some outliers reaching 1-2 seconds.
Latency:
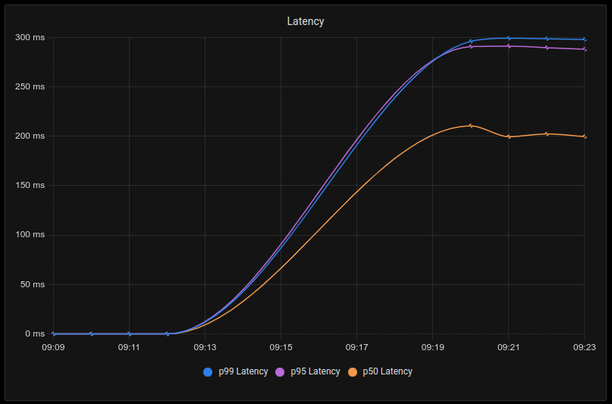
.
Duration, 50th percentile:
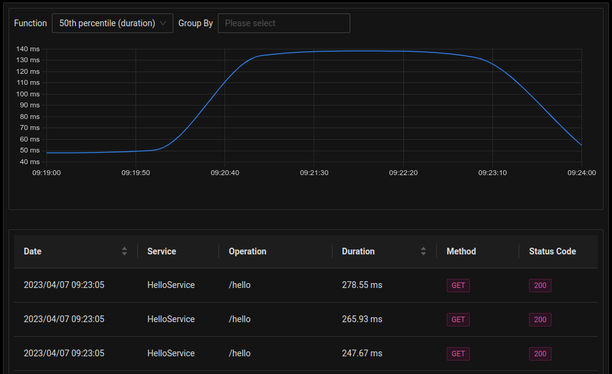 .
.
Finally, to measure the exact duration of our slow method and compare it with the full response time of our API, let's add a manual instrumentation:
public class Service
{
    private static Random _rand = new Random();

    async public static Task<Hello> run()
    {
        using var activity = DiagnosticsConfig.ActivitySource.StartActivity("SlowSleep");

        var sleepTime = _rand.Next(100, 300);

        await Task.Delay(sleepTime);

        return new Hello($"Sleeped for {sleepTime}");
    }
}
Build and run this version, add load again with ab, wait a few minutes then refresh the
SigNoz Traces page. Now in the Operation section of the filters you will see both
a /hello and a SlowSleep option. You can check either of them to see the average
durations and other metrics. In my case the SlowSleep operation showed a more consistent
average duration between 199-201 ms, the /hello operation took a little more time
averaging between 199-205ms.
Sources: