Production-ready microservice in Rust: 11. OpenTelemetry
Posted 2023-11-19 12:40:00 by sanyi ‐ 7 min read
Forwarding tracing data to SigNoz using OpenTelemetry
In this article I will implement the basics of OpenTelemetry integration. What is OpenTelemetry? According to their site opentelemetry.io:
"OpenTelemetry is a collection of tools, APIs, and SDKs. Use it to instrument, generate, collect, and export telemetry data (metrics, logs, and traces) to help you analyze your software’s performance and behavior."
We already use tracing in this application, but the events are simply written to the standard output. Using OpenTelemetry we can forward this data into various data collectors.
There are multiple open-source options such as Jaeger, Zipkin and SigNoz. I used SigNoz for these tests.
The test setup is quite simple. Clone the SigNoz repository:
git clone -b main https://github.com/SigNoz/signoz.git && cd signoz/deploy/
and run the install.sh in the signoz/deploy directory:
./install.sh
The script will setup a test environment using docker-compose, it takes a few minutes to create all the containers and initialize the database.
When the setup completes, open the administration console and create the default
admin user at http://localhost:3301/.
After login you will see the traces of the SigNoz application itself.
SigNoz listens for OpenTelemetry data via the OTLP protocol on port 4317, so our
rust application will access it on this url: http://localhost:4317
First I added a few more endpoints to the application: a simple GET /v1/dogs endpoint
to list all the dogs from the database and a GET /v1/dogs/:id endpoint to get information
about a single dog.
The new handlers in api::handlers::dogs.rs:
pub async fn list(
    State(state): State<Arc<ApplicationState>>,
) -> Result<Json<DogListResponse>, AppError> {
    let dogs = Dog::find().all(state.db_conn.load().as_ref()).await?;
    let n = dogs.len();

    let response = DogListResponse {
        status: Status::Success,
        data: dogs,
    };

    tracing::info!("number of dogs: {}", n);

    Ok(Json(response))
}

pub async fn get(
    State(state): State<Arc<ApplicationState>>,
    Path(dog_id): Path<i32>,
) -> Result<Json<DogGetResponse>, AppError> {
    let dog = Dog::find_by_id(dog_id)
        .one(state.db_conn.load().as_ref())
        .await?;

    let response = DogGetResponse {
        status: Status::Success,
        data: dog,
    };

    Ok(Json(response))
}
The corresponding data structures in api::response::dog.rs:
#[derive(Serialize)]
pub struct DogListResponse {
    pub status: Status,
    pub data: Vec<Model>,
}

#[derive(Serialize)]
pub struct DogGetResponse {
    pub status: Status,
    pub data: Option<Model>,
}
The extended routing in api::v1.rs:
pub fn configure(state: Arc<ApplicationState>) -> Router {
    Router::new()
        .route(
            "/hello",
            get(handlers::hello::hello).with_state(state.clone()),
        )
        .route(
            "/login",
            post(handlers::login::login).with_state(state.clone()),
        )
        .route(
            "/dogs",
            post(handlers::dogs::create)
                .with_state(state.clone())
                .route_layer(middleware::from_fn_with_state(state.clone(), auth)),
        )
        .route("/dogs", get(handlers::dogs::list).with_state(state.clone()))
        .route("/dogs/:id", get(handlers::dogs::get).with_state(state))
}
These endpoints are not authenticated, anyone can retrieve information about the dogs.
Now move on to the OpenTelemetry integration. First, we have to remove the global
tracing subscriber from main.rs:
let subscriber = Registry::default()
    .with(LevelFilter::from_level(Level::DEBUG))
    .with(tracing_subscriber::fmt::Layer::default().with_writer(std::io::stdout));

tracing::subscriber::set_global_default(subscriber).expect("Failed to set subscriber");
because we will create a new subscriber in commands::serve.rs and the subscriber
cannot be updated, we can set it only once during application initialization.
We have to add a few new dependencies in Cargo.toml and update some existing ones:
[dependencies]
tracing-subscriber = { version = "0.3.18", features = ["registry", "env-filter"] }
tracing-opentelemetry = { version = "0.22" }
tower-http = { version = "0.4.3", features = ["trace"] }
opentelemetry = { version = "0.21.0", features = ["metrics", "logs"] }
opentelemetry_sdk = { version = "0.21.1", features = ["rt-tokio", "logs"] }
opentelemetry-otlp = { version = "0.14.0", features = ["tonic", "metrics", "logs"]  }
opentelemetry-semantic-conventions = { version = "0.13.0" }
opentelemetry-http = "0.10.0"
The version numbers are important, because there are incompatibilities between different versions.
I introduced a new configuration option too, to specify OpenTelemetry collector
url in settings.rs:
#[derive(Debug, Deserialize, Default, Clone)]
#[allow(unused)]
pub struct Tracing {
    pub otlp_endpoint: Option<String>,
}

#[derive(Debug, Deserialize, Default, Clone)]
#[allow(unused)]
pub struct Settings {
    #[serde(default)]
    pub config: ConfigInfo,
    #[serde(default)]
    pub database: Database,
    #[serde(default)]
    pub logging: Logging,
    #[serde(default)]
    pub tracing: Tracing,
    #[serde(default)]
    pub token_secret: String,
    #[serde(default)]
    pub token_timeout_seconds: i64,
}
Most of the changes affect the commands::serve.rs module. The main part
in the start_tokio method:
global::set_text_map_propagator(TraceContextPropagator::new());

let otlp_endpoint = settings
    .tracing
    .otlp_endpoint
    .clone()
    .unwrap_or("http://localhost:4317".to_string());

let tracer = init_tracer(&otlp_endpoint)?;

let telemetry_layer = tracing_opentelemetry::layer().with_tracer(tracer);
let subscriber = tracing_subscriber::registry()
    .with(LevelFilter::from_level(Level::DEBUG))
    .with(telemetry_layer);

subscriber.init();

let _meter_provider = init_metrics(&otlp_endpoint);
let _log_provider = init_logs(&otlp_endpoint);
We setup trace data propagation, then fetch the otlp_endpoint url
from settings, defaulting to http://localhost:4317.
Initialize the tracer, create an OpenTelemetry layer for the tokio tracing library with this tracer and setup the subscriber to use the OpenTelemetry layer for data processing. Finally we initialize the subscriber.
We setup a metrics and a logs provider too, but we are not using them yet, that's why the variable names are prefixed with underscores.
Now the three initialization methods. First, init_tracer:
fn init_tracer(otlp_endpoint: &str) -> Result<sdktrace::Tracer, TraceError> {
    opentelemetry_otlp::new_pipeline()
        .tracing()
        .with_exporter(
            opentelemetry_otlp::new_exporter()
                .tonic()
                .with_endpoint(otlp_endpoint),
        )
        .with_trace_config(
            sdktrace::config().with_resource(Resource::new(vec![KeyValue::new(
                "service.name",
                "shelter-project",
            )])),
        )
        .install_batch(runtime::Tokio)
}
This is a fairly standard OTLP initialization, we only pass an endpoint url and
a service.name configuration to the tracer.
Similarly for metrics:
fn init_metrics(otlp_endpoint: &str) -> opentelemetry::metrics::Result<MeterProvider> {
    let export_config = ExportConfig {
        endpoint: otlp_endpoint.to_string(),
        ..ExportConfig::default()
    };
    opentelemetry_otlp::new_pipeline()
        .metrics(runtime::Tokio)
        .with_exporter(
            opentelemetry_otlp::new_exporter()
                .tonic()
                .with_export_config(export_config),
        )
        .with_resource(Resource::new(vec![KeyValue::new(
            opentelemetry_semantic_conventions::resource::SERVICE_NAME,
            "shelter-project",
        )]))
        .build()
}
and logs:
fn init_logs(otlp_endpoint: &str) -> Result<opentelemetry_sdk::logs::Logger, LogError> {
    opentelemetry_otlp::new_pipeline()
        .logging()
        .with_log_config(
            Config::default().with_resource(Resource::new(vec![KeyValue::new(
                opentelemetry_semantic_conventions::resource::SERVICE_NAME,
                "shelter-project",
            )])),
        )
        .with_exporter(
            opentelemetry_otlp::new_exporter()
                .tonic()
                .with_endpoint(otlp_endpoint.to_string()),
        )
        .install_batch(runtime::Tokio)
}
One more thing before we start to test our application: add instrumentations on our dog handler methods:
#[instrument(level = "info", name = "create_dog", skip_all)]
pub async fn create(...) { ... }

#[instrument(level = "info", name = "list_dogs", skip_all)]
pub async fn list(...) { ... }

#[instrument(level = "info", name = "get_dog", skip_all)]
pub async fn get(...) { ... }
Check the linked sources for some missing details, like required use statements!
Now we can compile and start the application:
$ cargo build
$ export SHELTER__DATABASE__URL="postgresql://postgres:[email protected]/shelter"
$ ./target/debug/shelter_main serve
Call the list endpoint a few times to generate some data:
$ curl http://127.0.0.1:8080/v1/dogs | json_pp
Now if you go to SigNoz on http://127.0.0.1:3301/ you can see the results.
First select the Services menu to check that you can see the shelter-project
application. It may not appear instantly, give it a minute or two and reload the page.
When it appears go to the Traces menu and look for the Service Name filter.
Clear all checkboxes and select the shelter-project only - all other traces are
related to the SigNoz application itself.
Now you will see something like this:
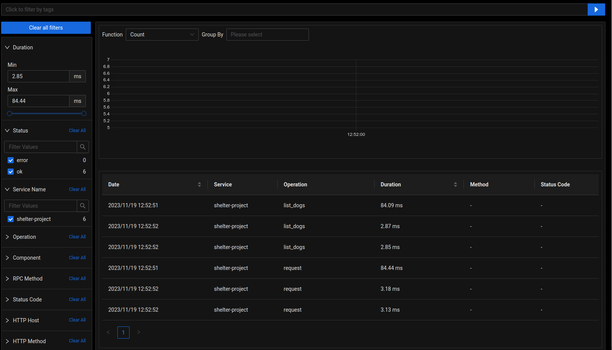 .
.
entries with request and list_dogs operations.
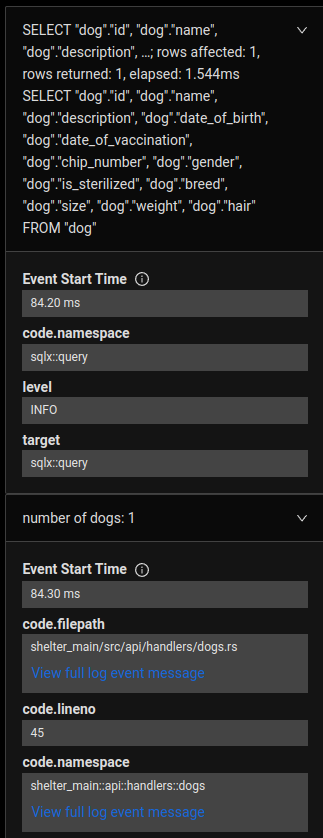
If you click on one of the request operations you will see that it encapsulates
a list_dogs operation. If you click on the list_dogs operation and select the
Events tab on the right side you can even see the details of each event, like
the exact SQL query executed and our tracing::info! call with the number of the
dogs.
 .
.
You can further browse the interface to see metrics like average duration of the operations, rate of the requests, etc.
You can find the sample code on GitHub